- Work
- Visuologia
Visuologia
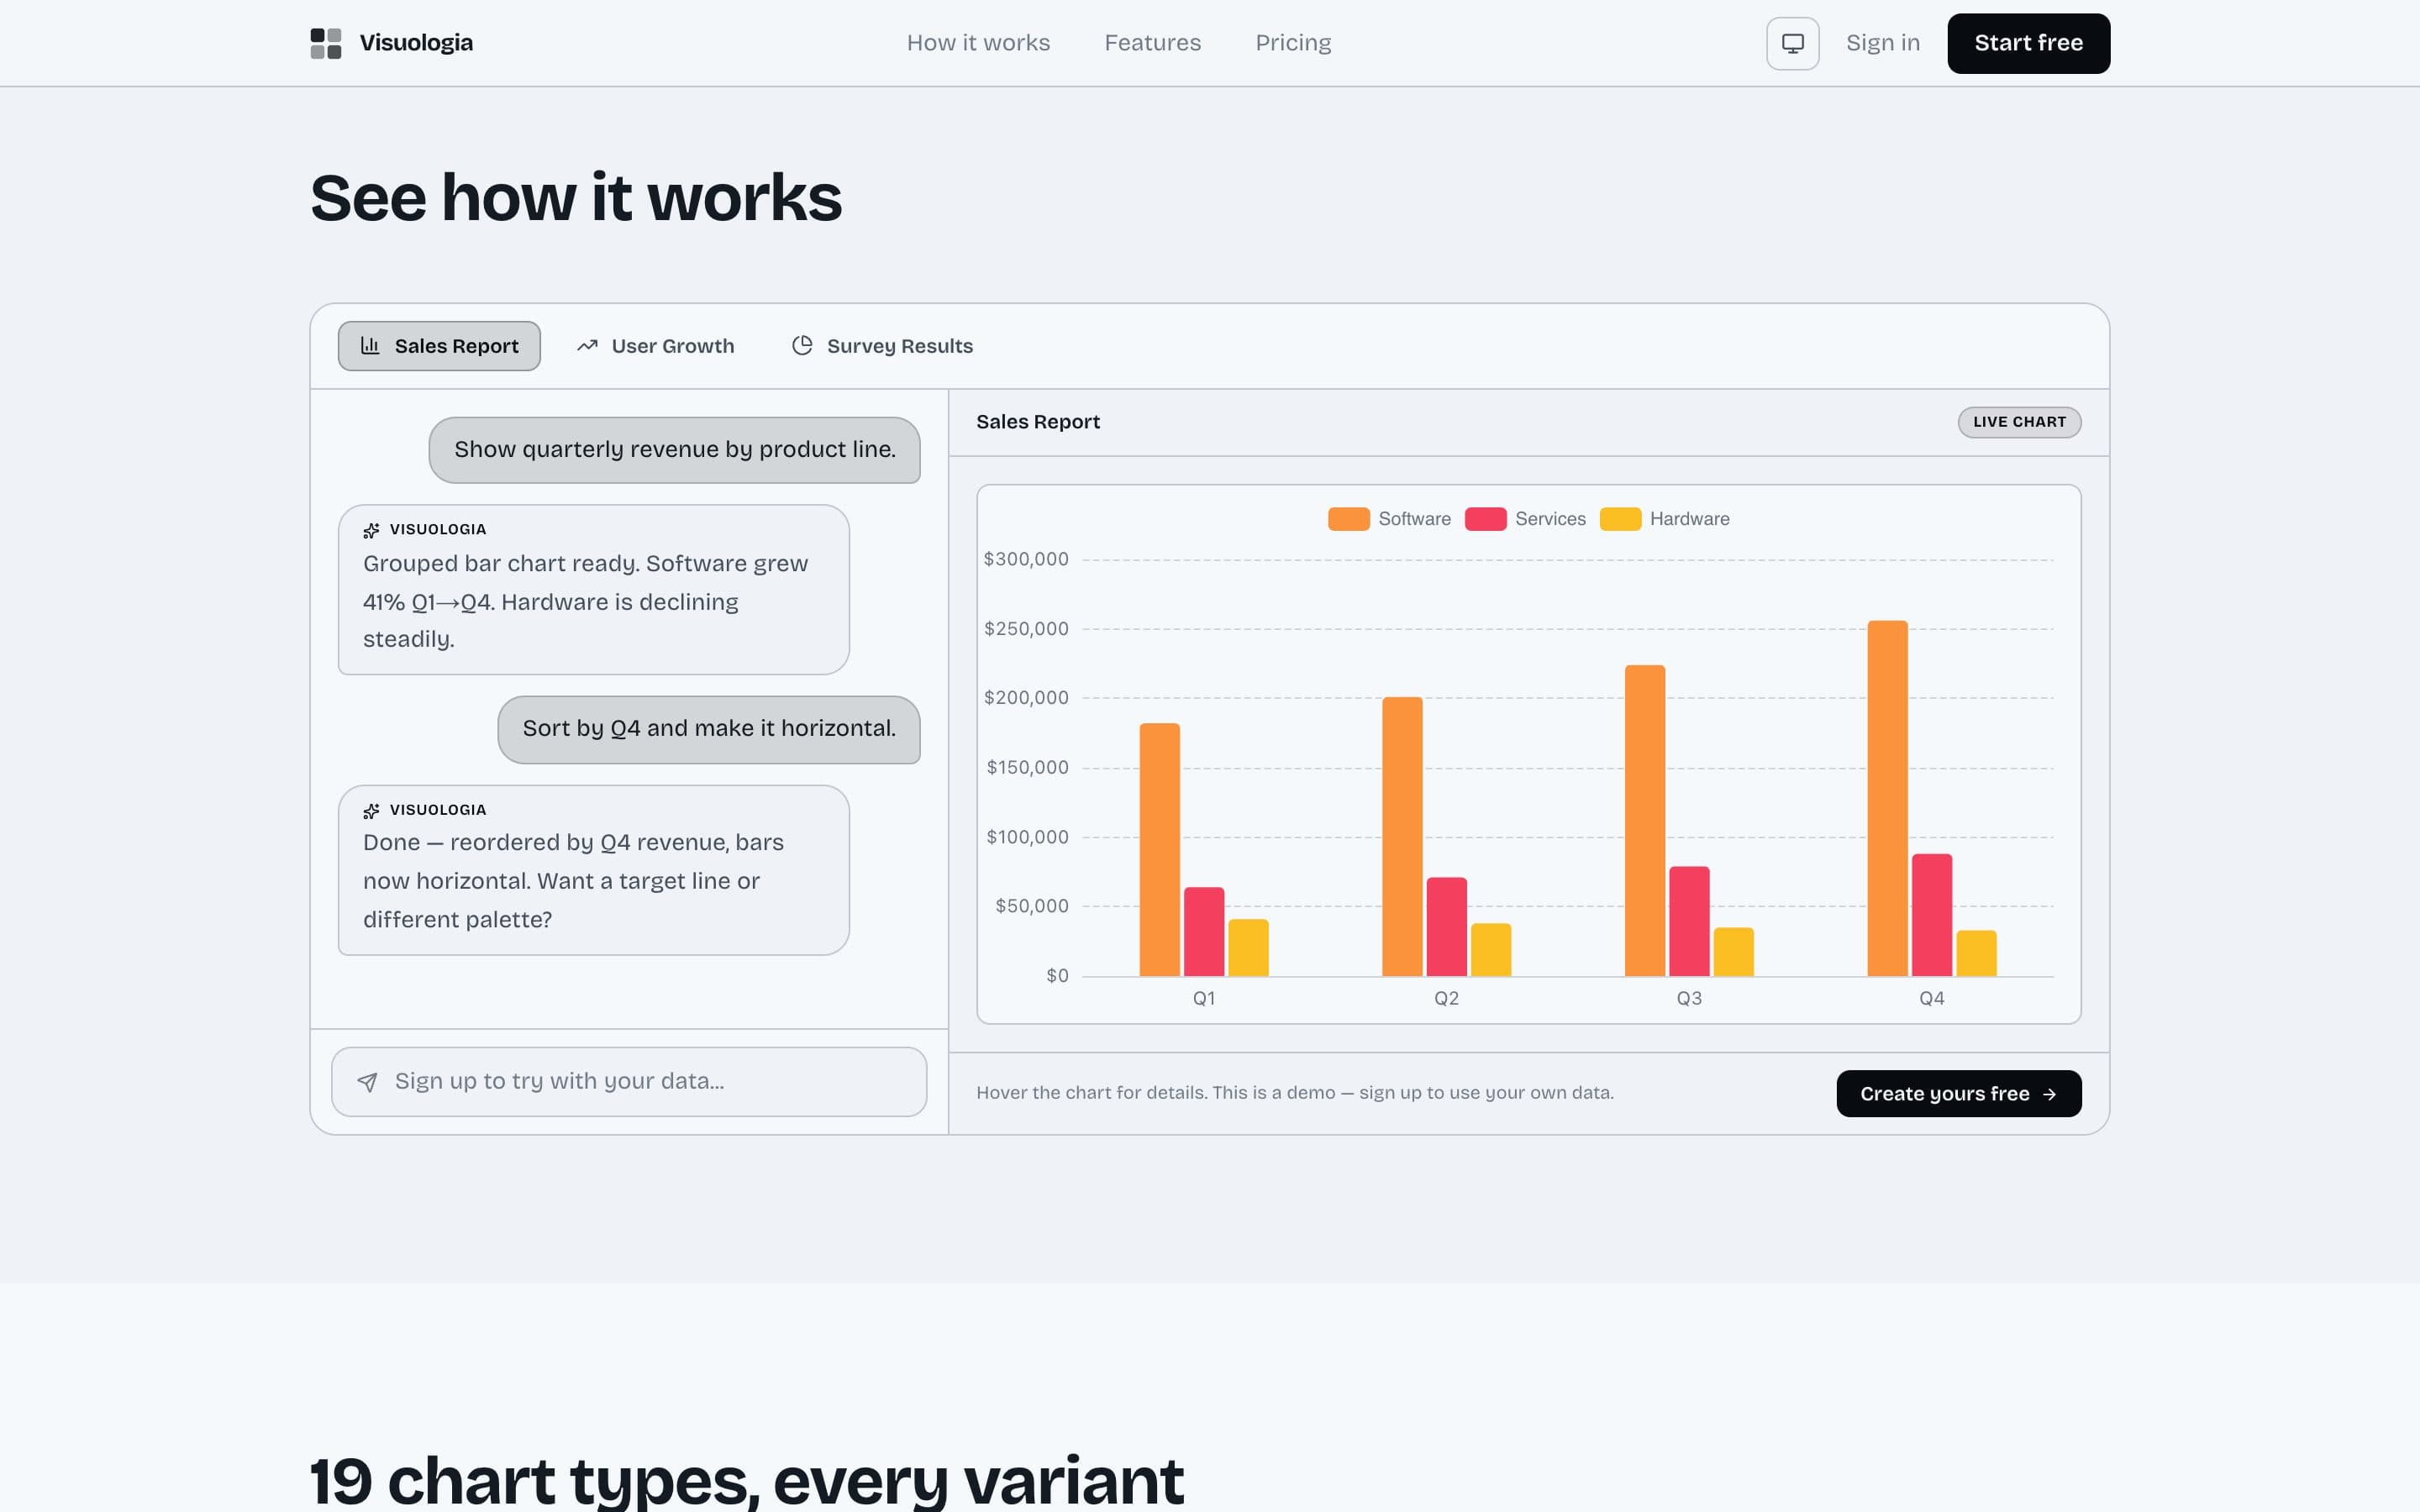
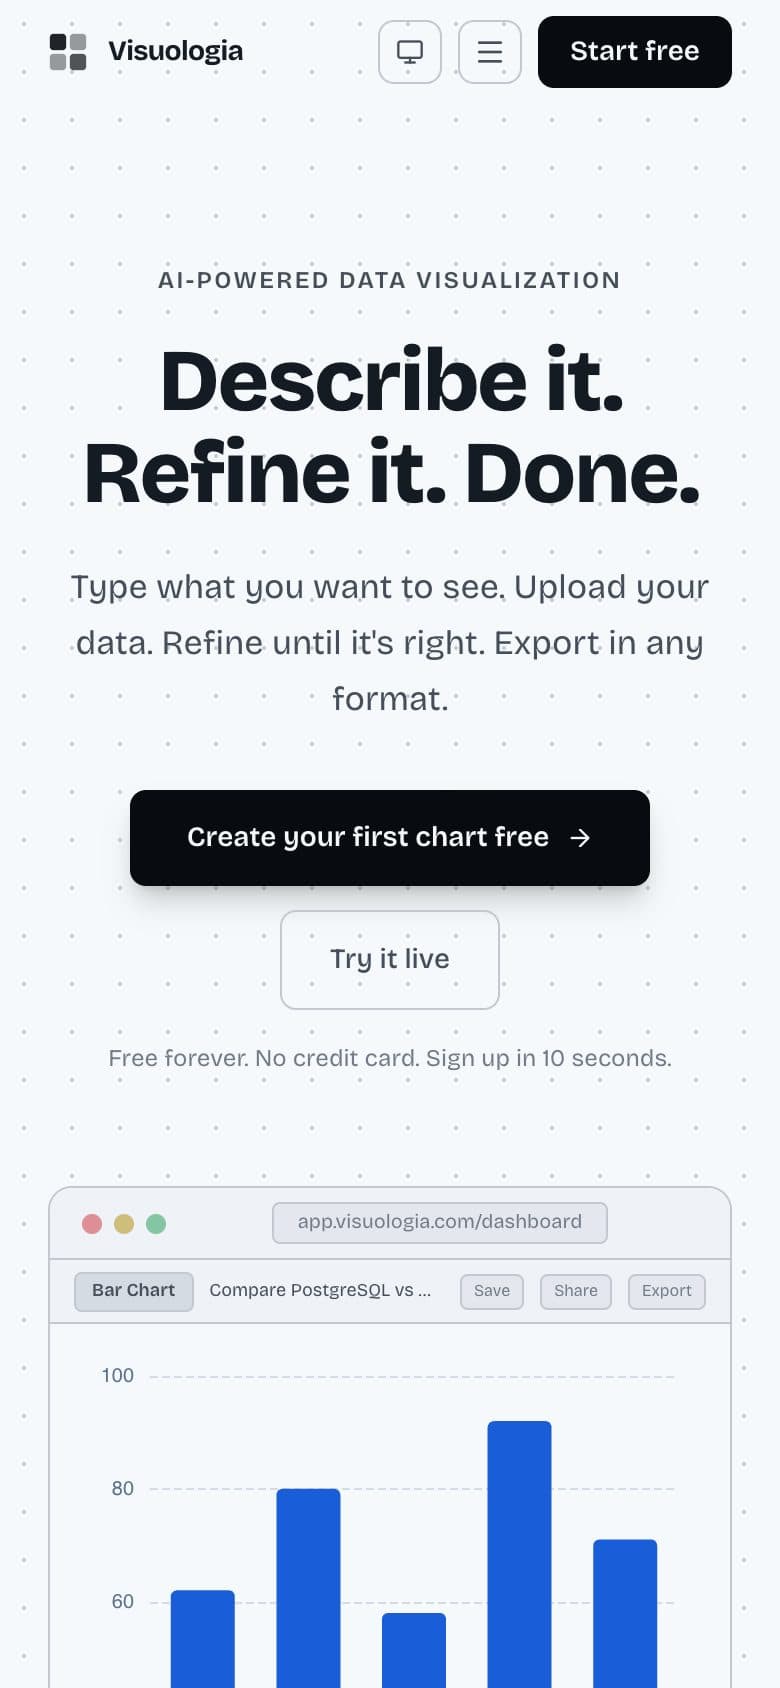
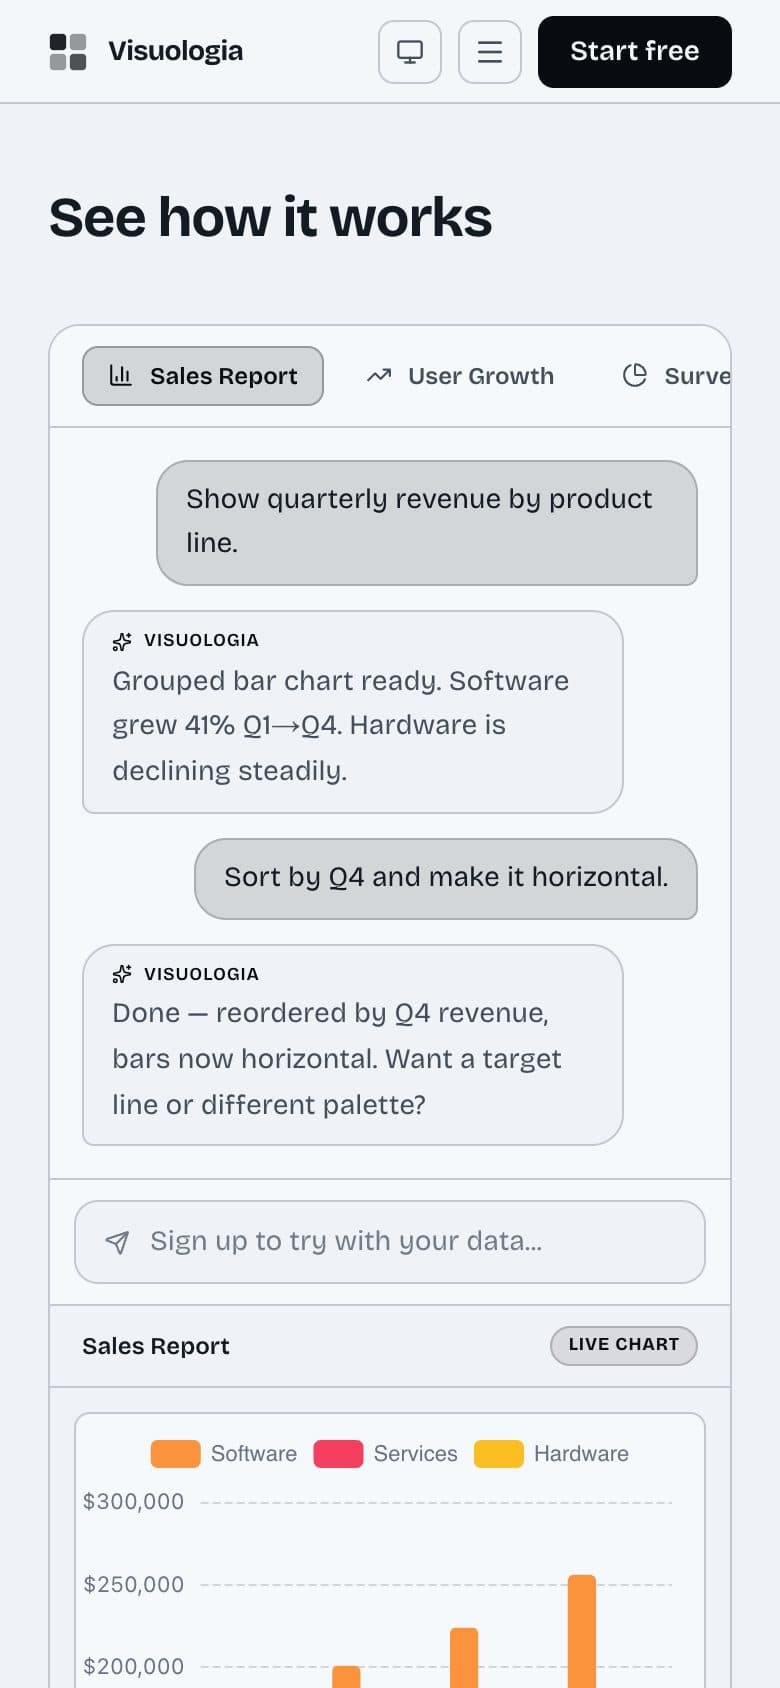
Describe a chart in plain English. Get it back, ready to ship.
Styles
visuologiavisualme.vercel.app (opens in a new tab)
An AI charting tool for people who know their data but not D3
- year
- 2026
- client
- Self-initiated
- role
- Solo build
- stack
- Next.js, TypeScript, OpenAI, D3, Tailwind, PostgreSQL
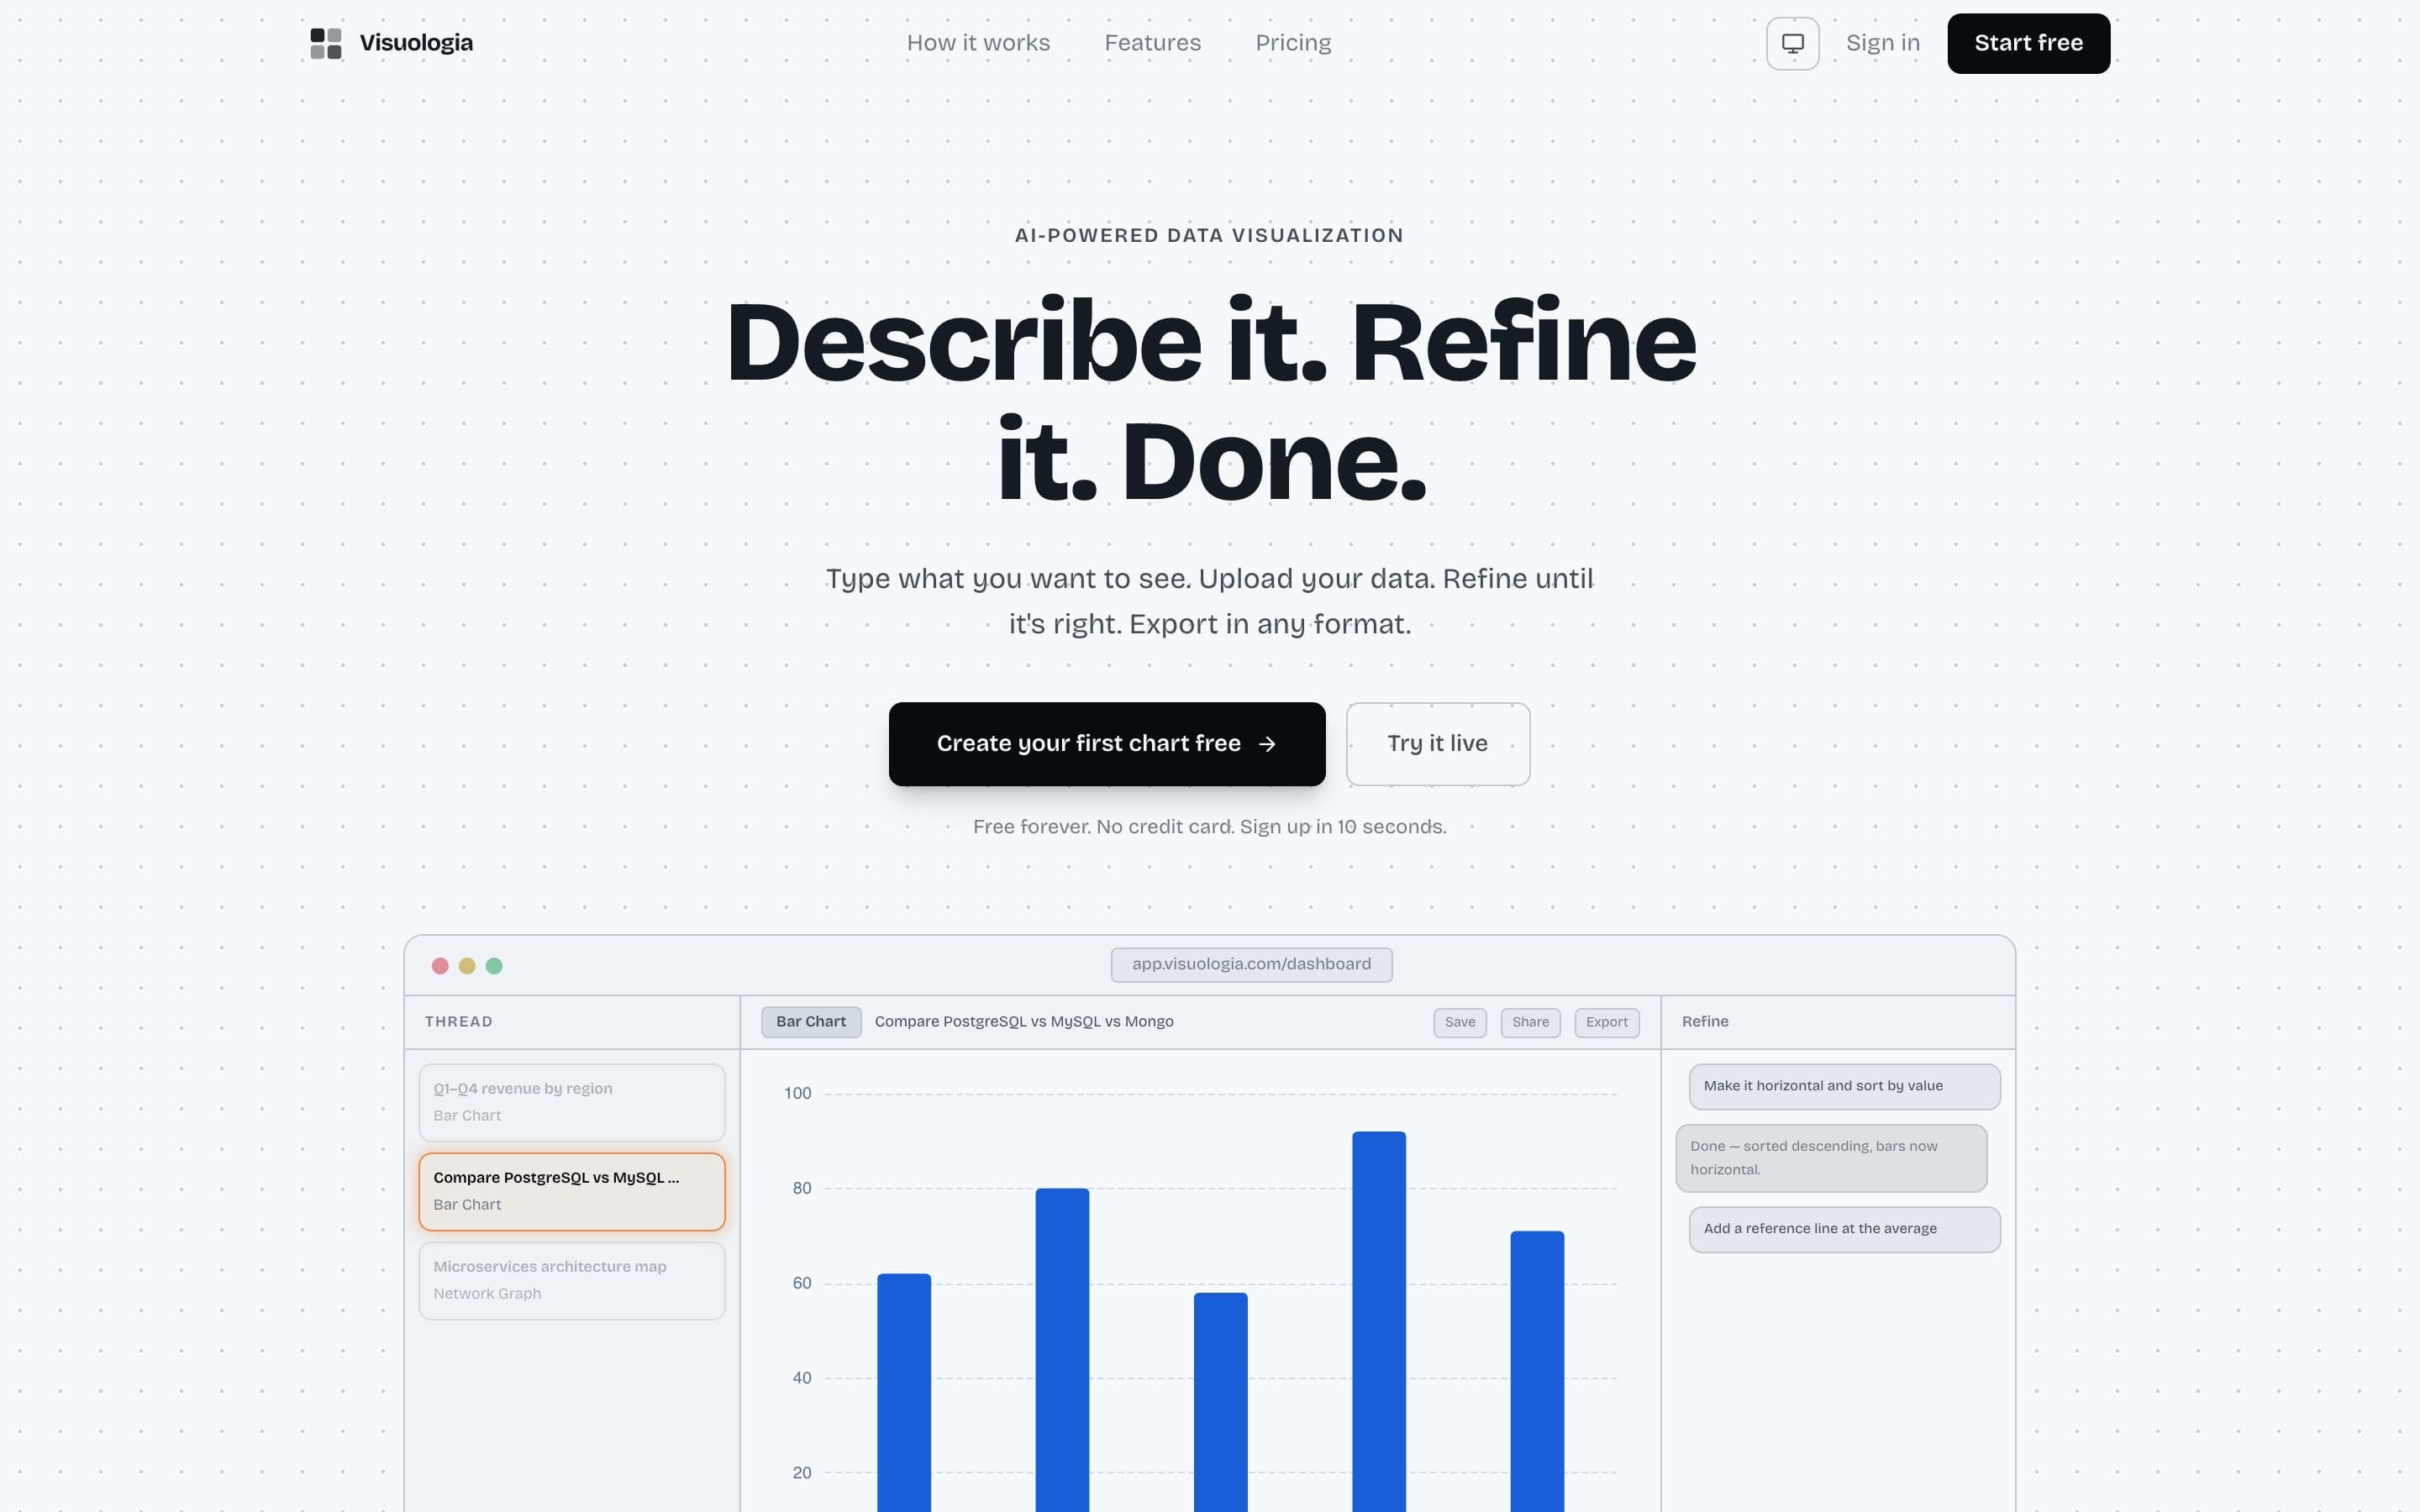 Each chart keeps its own threadRefinements are typed in plain English
How it was built
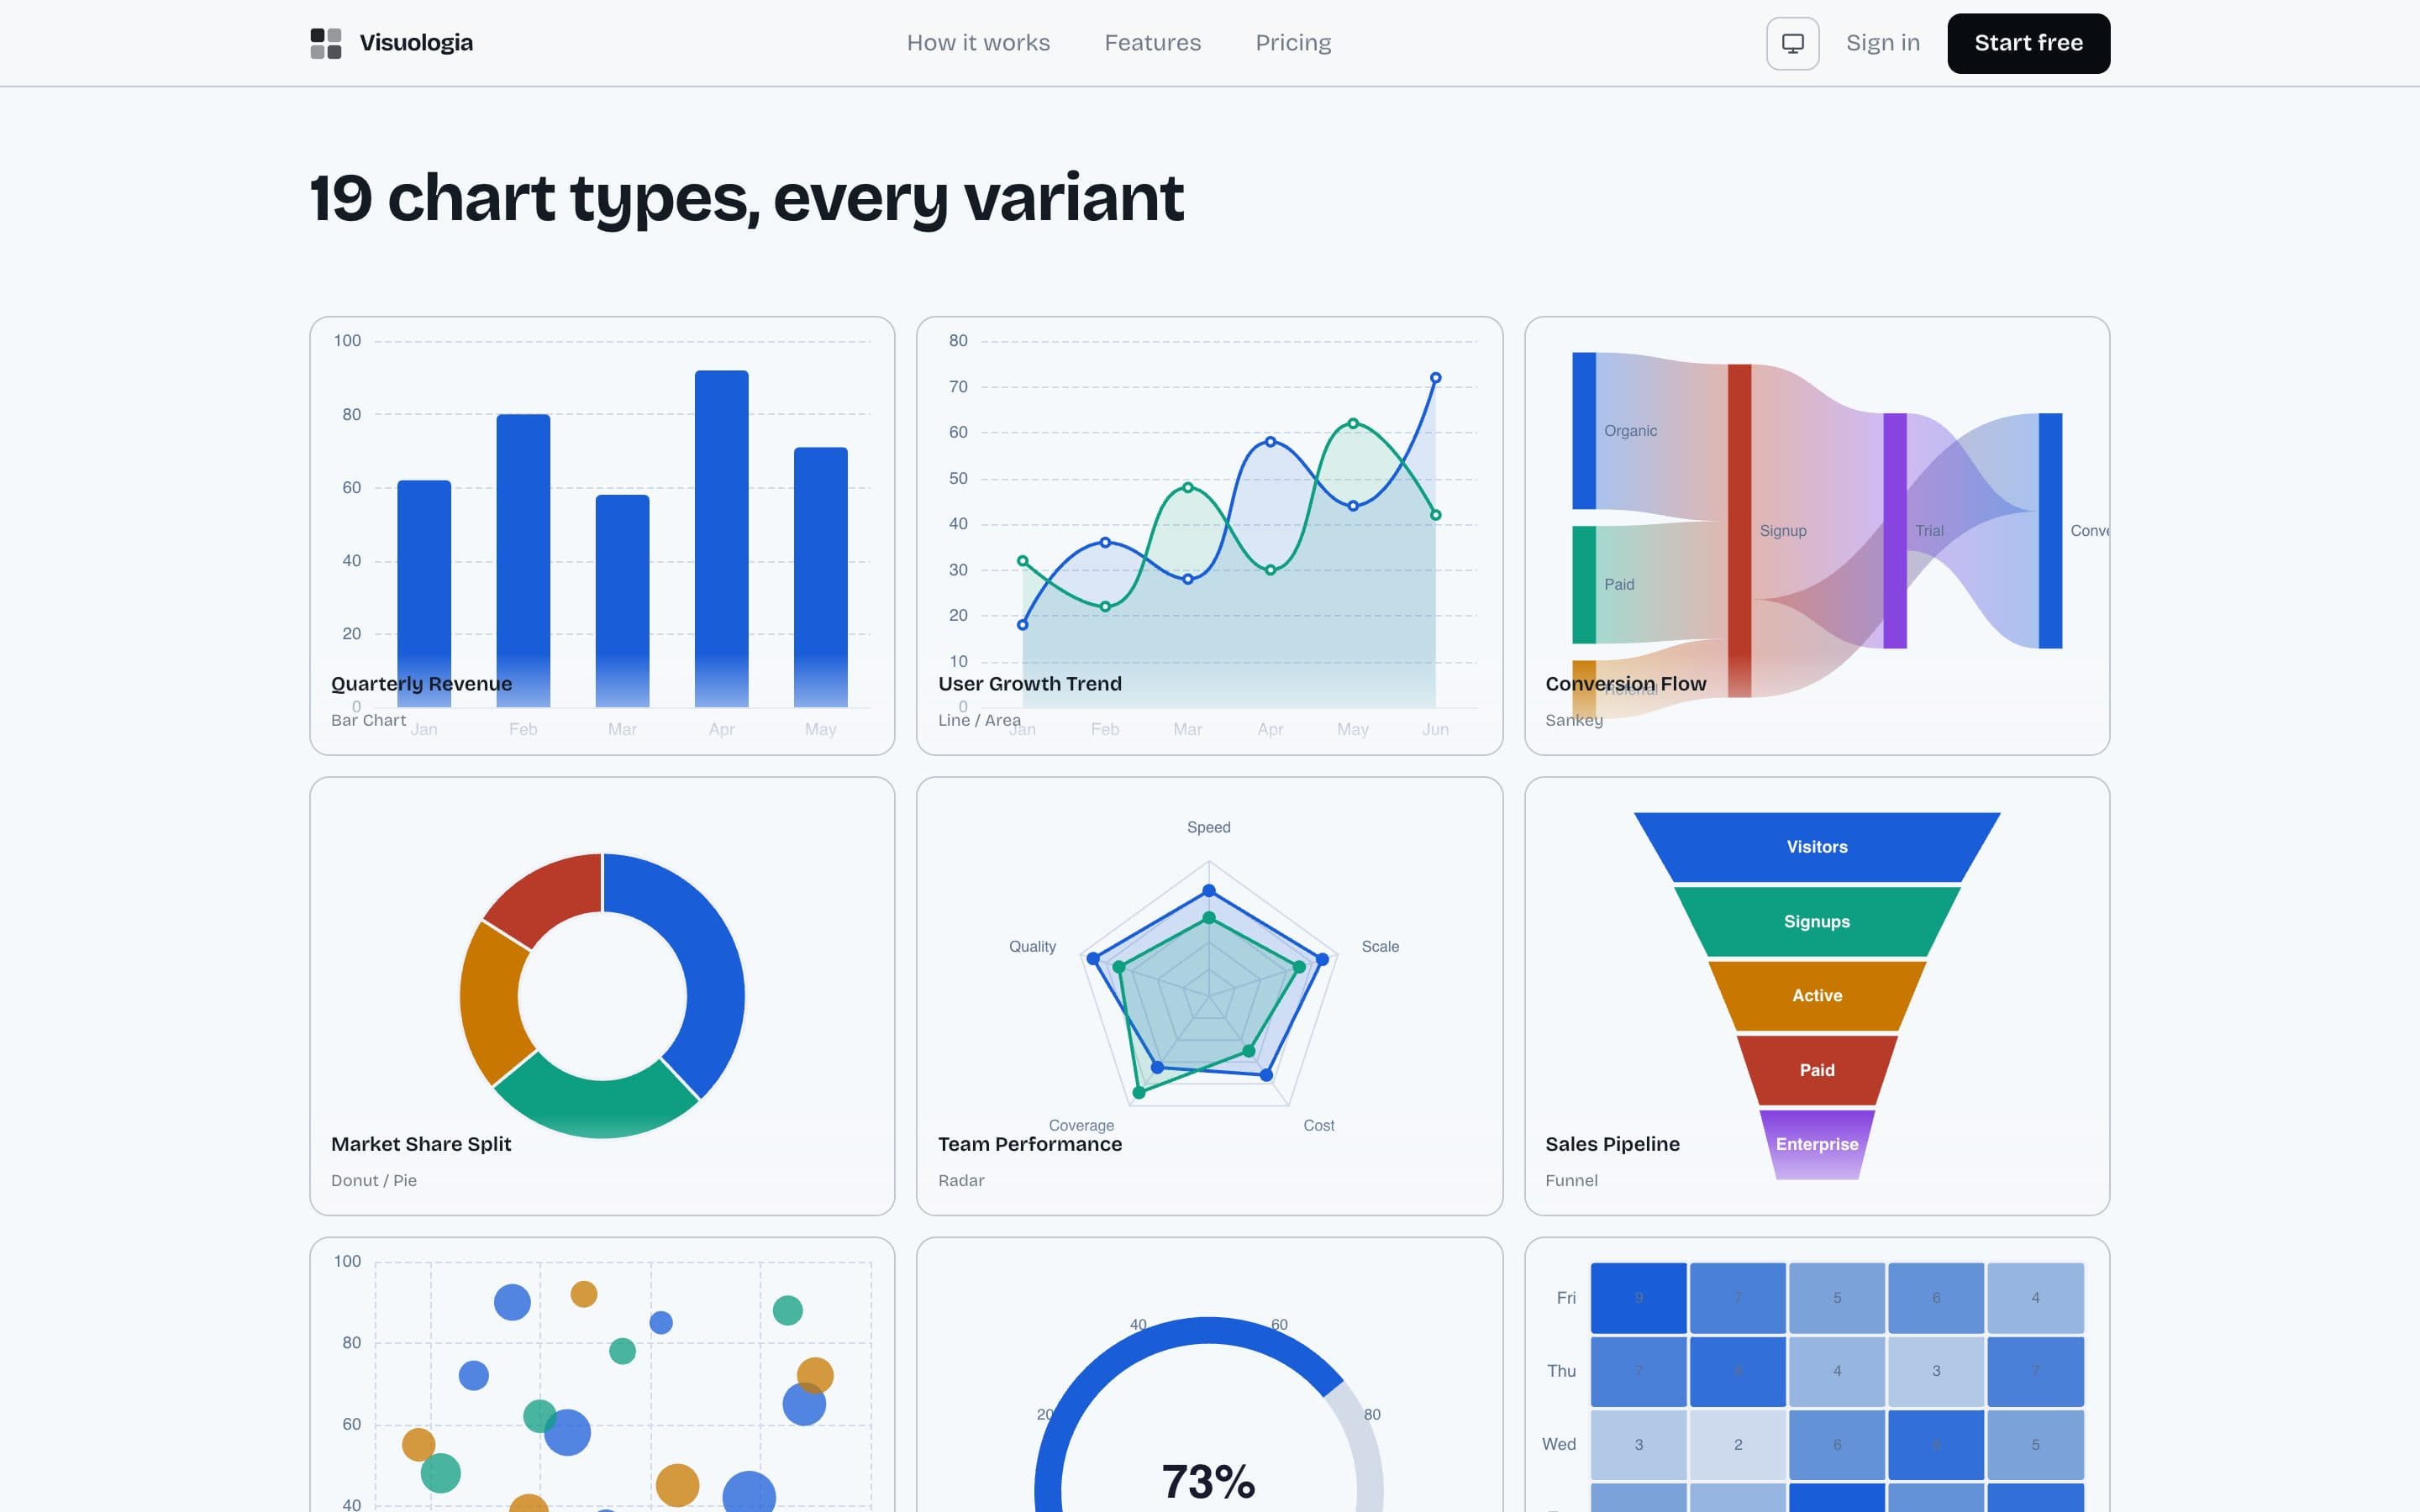
An AI charting tool for people who know their data but not D3. You describe what you want — or drop a CSV, JSON or XLSX — and it returns a real visualisation you can keep refining in conversation. Nineteen chart families, statistical tests that run client-side, Google Sheets bound to live-updating charts, and export to PNG, SVG, PDF, HTML, JSON or CSV.
Computed
computed
Counts of what shipped, not outcomes
- chart-families
- 19
- export-formats
- 6
- input-formats
- 3